The Dead of the Jersey
On any given morning in Wallabout bay, just off of Brooklyn in the East River, a routine announcement from the British drifted across the festering hold of the prison ship HMS Jersey: “Rebels, turn out your dead.” The prisoners, made up primarily of soldiers, sailors, privateers, and the like, emerged from the lower levels of the vessel designed for 400 men but was currently crammed with at least 1,100. They’d carry the bodies up to the front of the ship which were then lowered over the side, carried by a rope around the torso, “in the same manner as tho’ they were beasts” recalled one survivor. They were then buried in holes just a foot or two deep. Up to eight men died on the Jersey every day. The air was so putrid one prisoner recorded that lamps couldn’t even be kept burning.
In the summer, they died suffocating deaths in the heat. In winter, they’d wake to three or four inches of snow with some dying in the night. They’d die of dysentery, typhus, smallpox, yellow fever, and starvation. By the time the Brits had evacuated New York in 1783, more than 11,000 Americans had died just on the British prison ships in New York Harbor based on modern estimates; more than twice the number killed in action across every battle of the war combined.
Who Died and How
Any honest attempt at an accounting of Revolutionary War mortality has to start with the confession of uncertainty. It has to be done based on incomplete, biased, and sometimes lost-altogether records (notably the War Department had fires in 1800 and 1814 that destroyed quite a few records). Muster rolls from the era survive for maybe three-quarters of the Continental regiments, while British documents are rather fragmented, and some Hessian records being better preserved, albeit imperfect. Then you get into the deaths among militias which are basically entirely undocumented and the civilian casualties which are just as difficult to count. Those caveats having been stated, we can at least outline the epidemiology of the American Revolution.
American Forces
The historian Howard Peckham attempted what is seen by many as the most rigorous systematic attempt to count American military deaths in his 1974 study and book The Toll of Independence. After combing through primary sources of engagement after engagement, he arrived at 6,824 killed in action across the entire war, noting that was likely ~1,000 too low given the incompleteness of the records. Today, groups like the American Battlefield Trust say somewhere around 6,800 were killed in battle with an upper bound of near 8,000.
Deaths from disease prove far harder to count while amounting to a far larger number. The most widely cited estimate from Cirillo’s 2008 analysis have anywhere from 17,000 to 18,500 American military deaths from disease. I’ll note that this is almost certainly an underestimate, given it reflects documented cases rather than actual deaths in the field, hospitals, or among militia who died and were never recorded. The disease-to-combat ratio for American forces based on Cirillo’s analysis was something like 2.6:1; however, it’s important to note that contemporary observers like Dr. James Thatcher, an army surgeon, estimated a true ratio at 10:1, as he incorporated deaths that were never officially counted including the enormous mortality events in Philadelphia hospitals in the winter of 1776 to 1777 as well as the deaths among discharged sick soldiers.
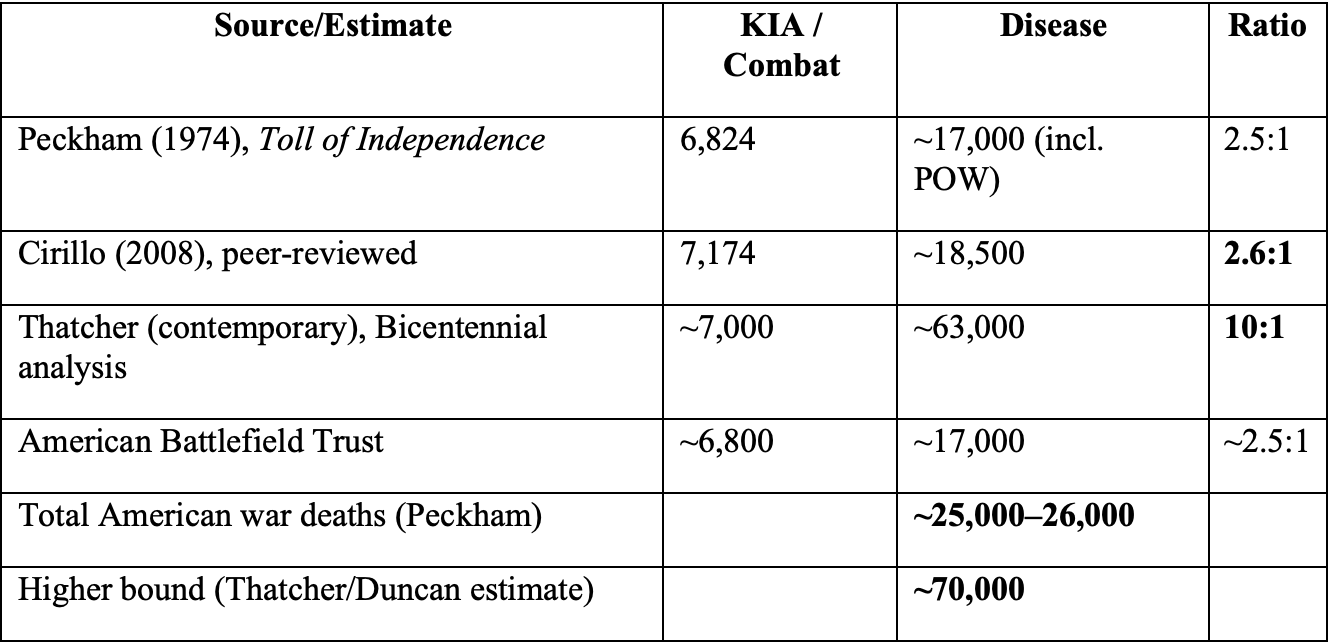
The wide range of 25,000 to 70,000 should be seen as reflecting the genuine uncertainty as opposed to reflexively thinking it may have been sloppy work. Those higher bounds take into account things like 22,000+ widows drawing pensions, the high mortality in POW situations, and deaths among the militia that weren’t formally recorded. For the purposes of this article, I go with the conservative figure of roughly 25,000 documented American military deaths (all while understanding it was likely somewhat higher in reality). Those POW conditions constituted a massive category, as somewhere around 18,000 Americans were taken prisoner across the war, of which 8,000 to 12,000 died while in British captivity in New York alone. Of the 2,400 captured at Fort Washington in November of 1776, less than 1,000 were alive to be exchanged 10 months later.
Taking into account he population at hand, the war’s population-adjusted scale was absolutely catastrophic. With only 2 million making up the population of the colonies, the death toll of the war represented roughly 1% of the population today. A proportionately equivalent event would cause around 3.5 million deaths in the modern United States. The U.S. Army Medical Department notes that Revolutionary War death rates of roughly 35 per 1000 colonists per year was double the proportionate death toll seen in the American Civil War.
British Forces
Records of British and Loyalist casualties tended to be substantially less well-documented. PBS and the American Battlefield Trust (thank you Ken Burns), note something like 24,000 total British casualties (including battlefield and disease deaths, prisoners, and those missing in action). Best estimates for battlefield casualties would be somewhere around 4,000 killed in action. The Brits had a major epidemiological advantage compared to the Patriots and that was prior immune exposure. British regulars would enlist for 21-year terms and tended to be drawn from urban populations where smallpox, typhus, and dysentery had been endemic since childhood. The British army physician Dr. Brocklesby noted “only 2 out of 9 soldiers have not had smallpox” giving ~80% of British regulars in the colonies prior immunity. Overall, British annual mortality rates were something like 118 per 1,000 per year, with Continental troops experiencing almost double that at 200 per 1,000.
Hessian Forces
The German auxiliary troops from the Hesse-Cassel region provide us with some well-documented casualty data for the war. Roughly 30,000 Hessians served, of which roughly 1,800 were killed in action and about 6,300 died of disease (an overall mortality rate of ~20% over the war and an annual disease death rate of about 62.5 per 1,000. They too tended to be more seasoned, urban-recruited individuals with higher prior immune experience; however that didn’t extend to some diseases in the South where they would suffer some of their greatest losses. In the summer and fall of 1780 the Hessian regiments in Charleston and Savannah were substantially reduced by malaria and fever.
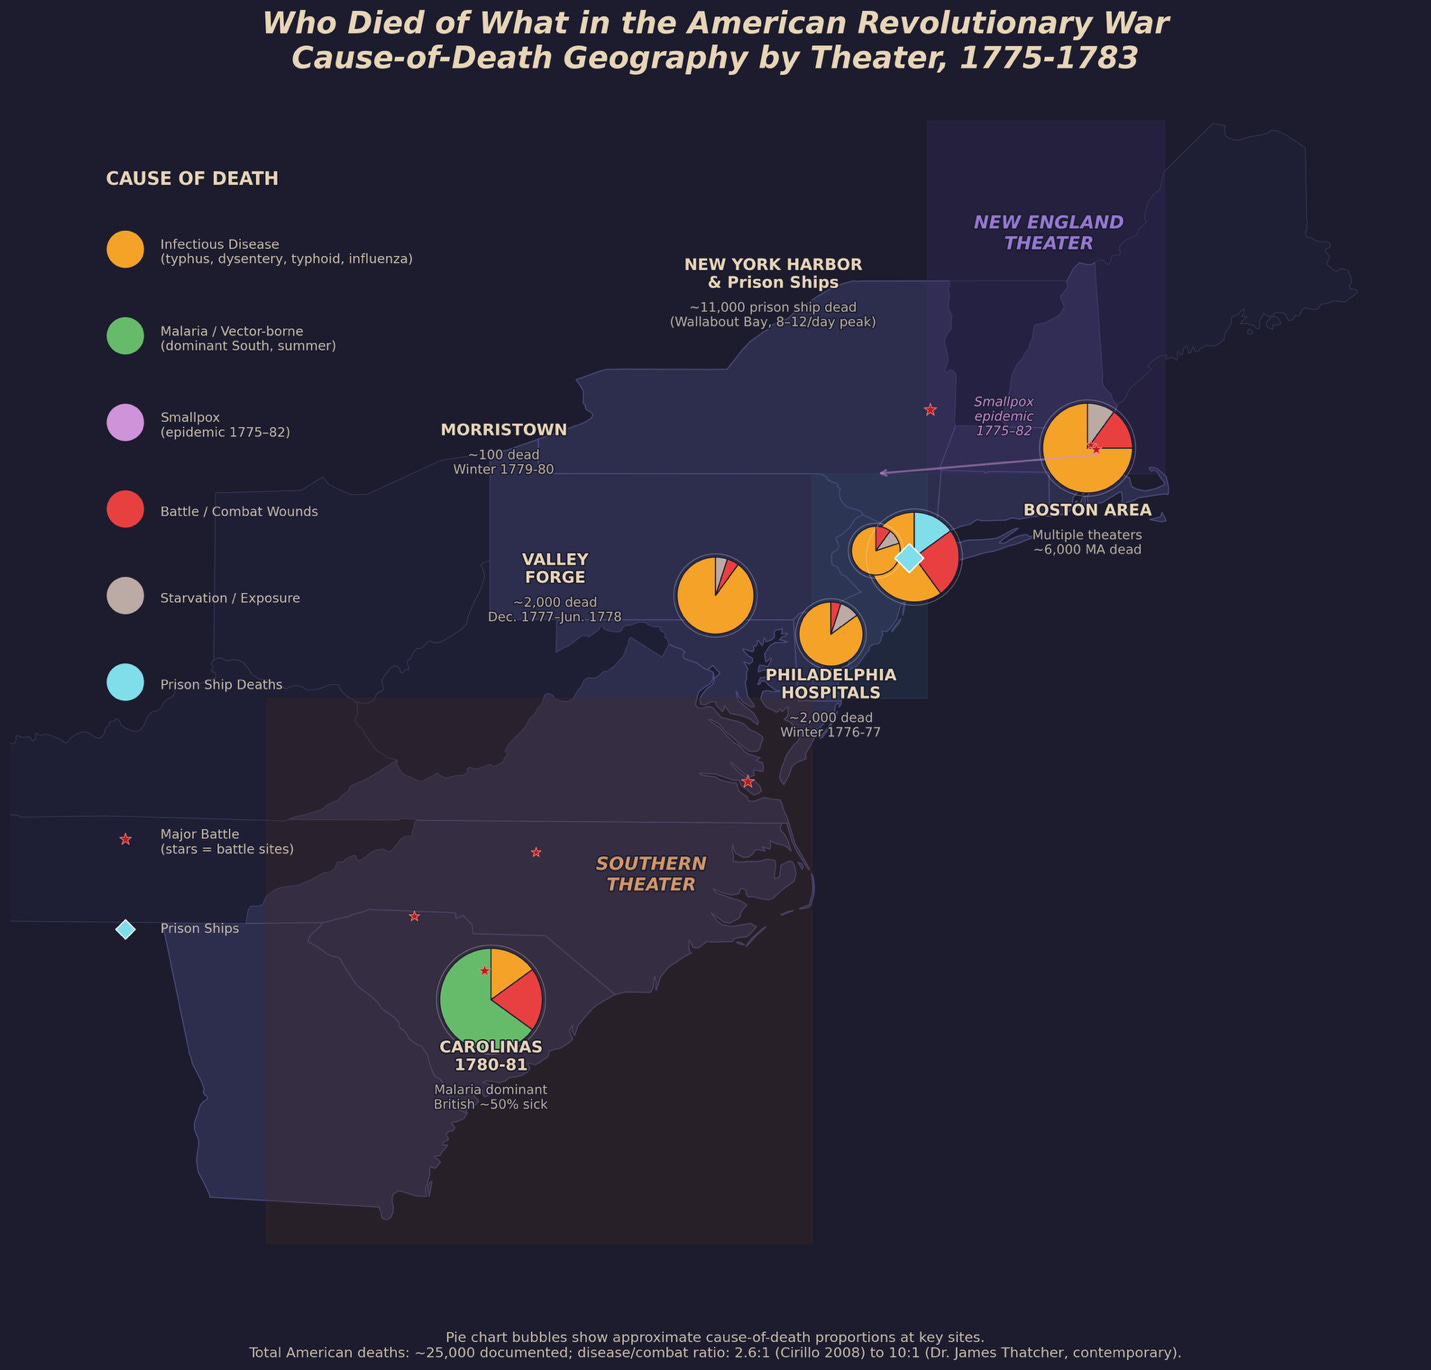
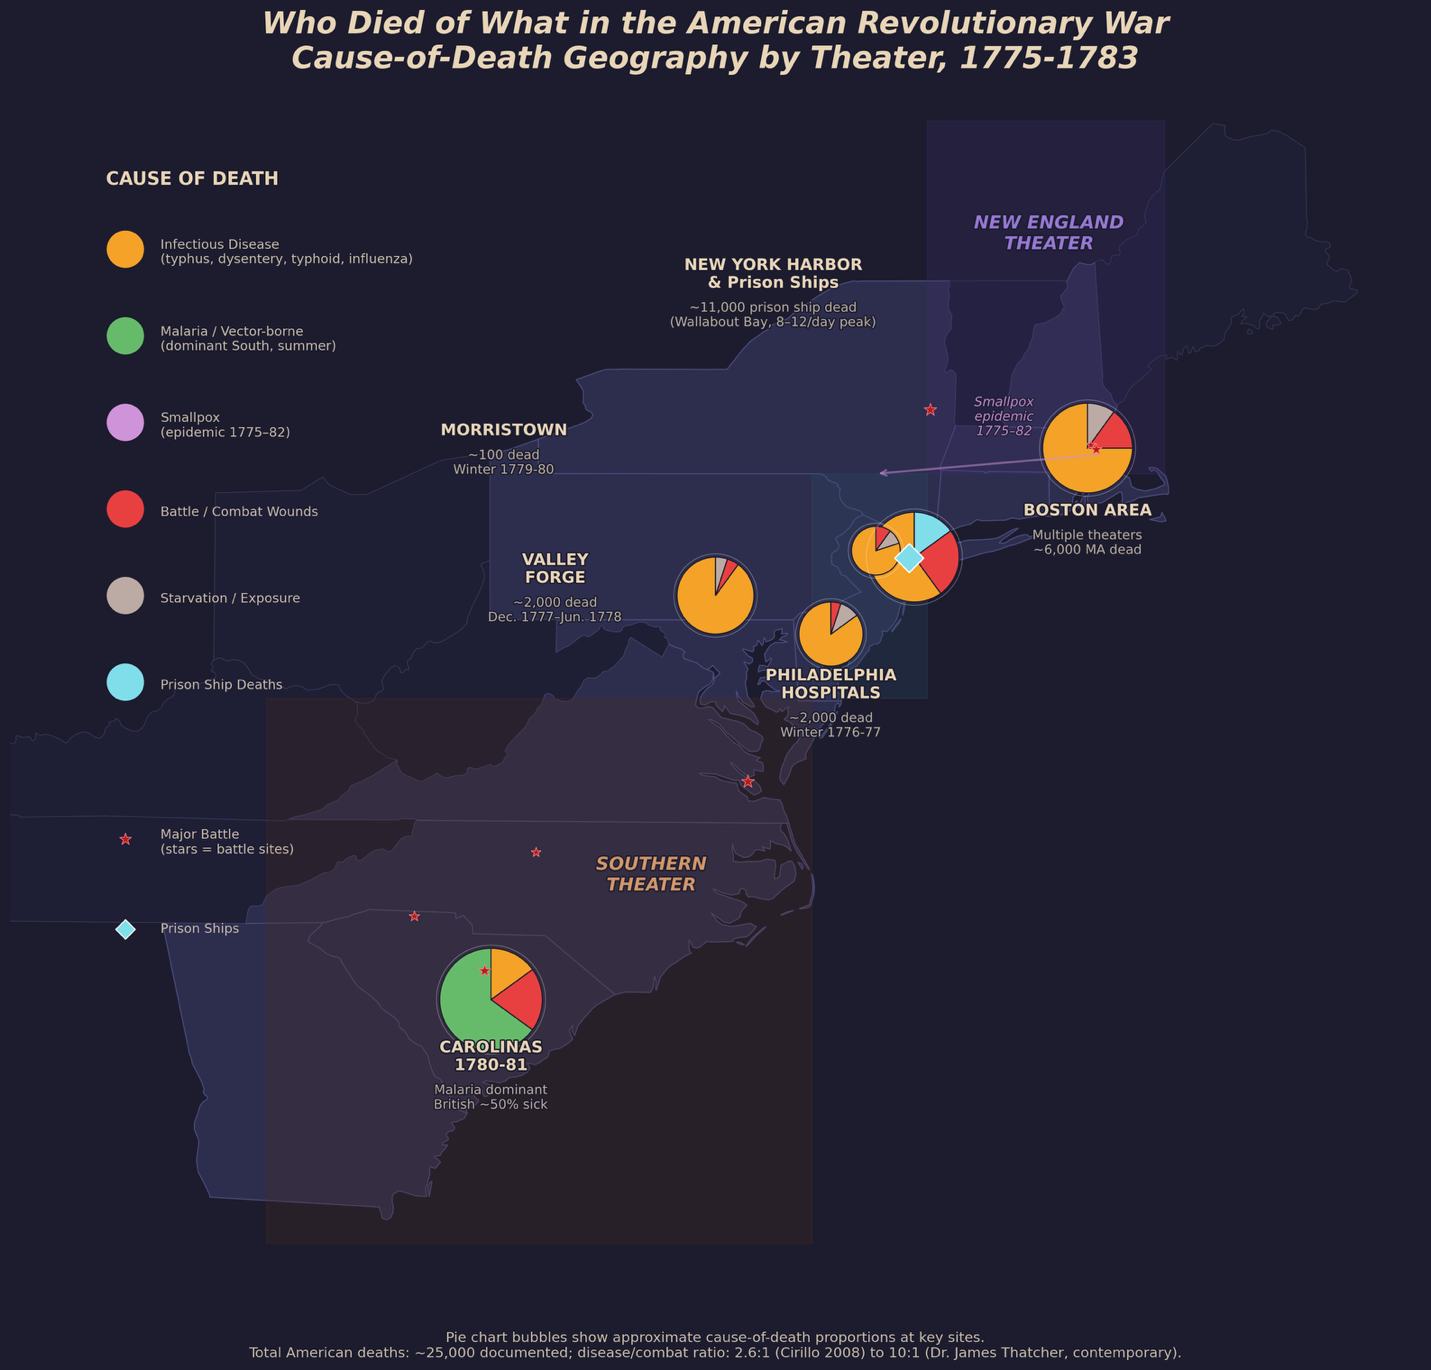
Figure 1. Geographic distribution and cause-of-death patterns across Revolutionary War theaters (1775-1783). Pie charts show approximate cause-of-death proportions; battle markers scaled to casualties. Visualizations generated using Python workflows assisted with Perplexity/Claude, based on historical estimates curated and interpreted by the author. All figures are approximate.
The Edge of Epidemiology is a reader-supported publication. To receive new posts and support my work, consider becoming a free or paid subscriber.
Disease as the Primary Killer
Diseases in the American Colonies were far from evenly spread, with the epidemiological profile of the war differing drastically depending on the theater, season, and year. In terms of total mortality, the major killers were (in order):
Typhus (“Camp Fever” or “Jail Fever”), caused by the Rickettsia prowazekii bacterium and transmitted by body lice, was described by the AMEDD historians as the worst enemy of the war. It thrived in the conditions that 18th-century military life came with: overcrowded barracks, prisons, and hospitals, a lack of laundry facilities, poor ventilation, and louse infested bedding. It was especially lethal on the prison ships of New York where they saw the most extreme overcrowding. This is difficult to distinguish from typhoid fever in the records due to both being lumped under “continued fever” or “putrid fever.”
Smallpox (Variola major) was a more strategically consequential disease, even if typhus takes the crown as having killed more in aggregate. Smallpox mortality rates from a natural infection were around 30% in the unimmunized populations. Thankfully, inoculation once inacted reduced that to about 1.5-2%. Most important was the differential susceptibility as mentioned earlier, with British regulars being far less susceptible than their American colonist counterparts. The epidemic of 1775 to 1782 is estimated at having killed 130,000 people across North America (including the Canadian colonies).
Dysentery, also called the “bloody flux” was most often bacillary dysentery caused by Shigella, was one of the diseases present across every theater of the war and during every season. It was responsible for the bulk of persistent “sick present” numbers in the muster return records. Each major encampment recorded it, as latrines were frequently too close to camp leading to contaminated water sources.
Malaria dominated in the Deep South and was a dominant cause of military feebleness in the Southern Theater. This is also where the prior immunity flips in favor of the American colonists. Those in the Carolinas and Virginia had grown up in the malarial swamplands and acquired partial immunity via repeated infection, whereas British soldiers from urban northern England had essentially one. In summer of 1780 malaria had left roughly a third of Cornwallis’ army at Camden too ill to fight. Historian Peter McCandless even concludes that disease did more to ensure American victory in the south than the patriots themselves.
Respiratory illness was more of a seasonal killer; with winter encampments being hit especially hard. This was particularly so in places like Valley Forge where the combination of overly crowded huts, inadequate clothes, and malnutrition induced immune suppression created the perfect conditions for influenza and pneumonia to circulate.
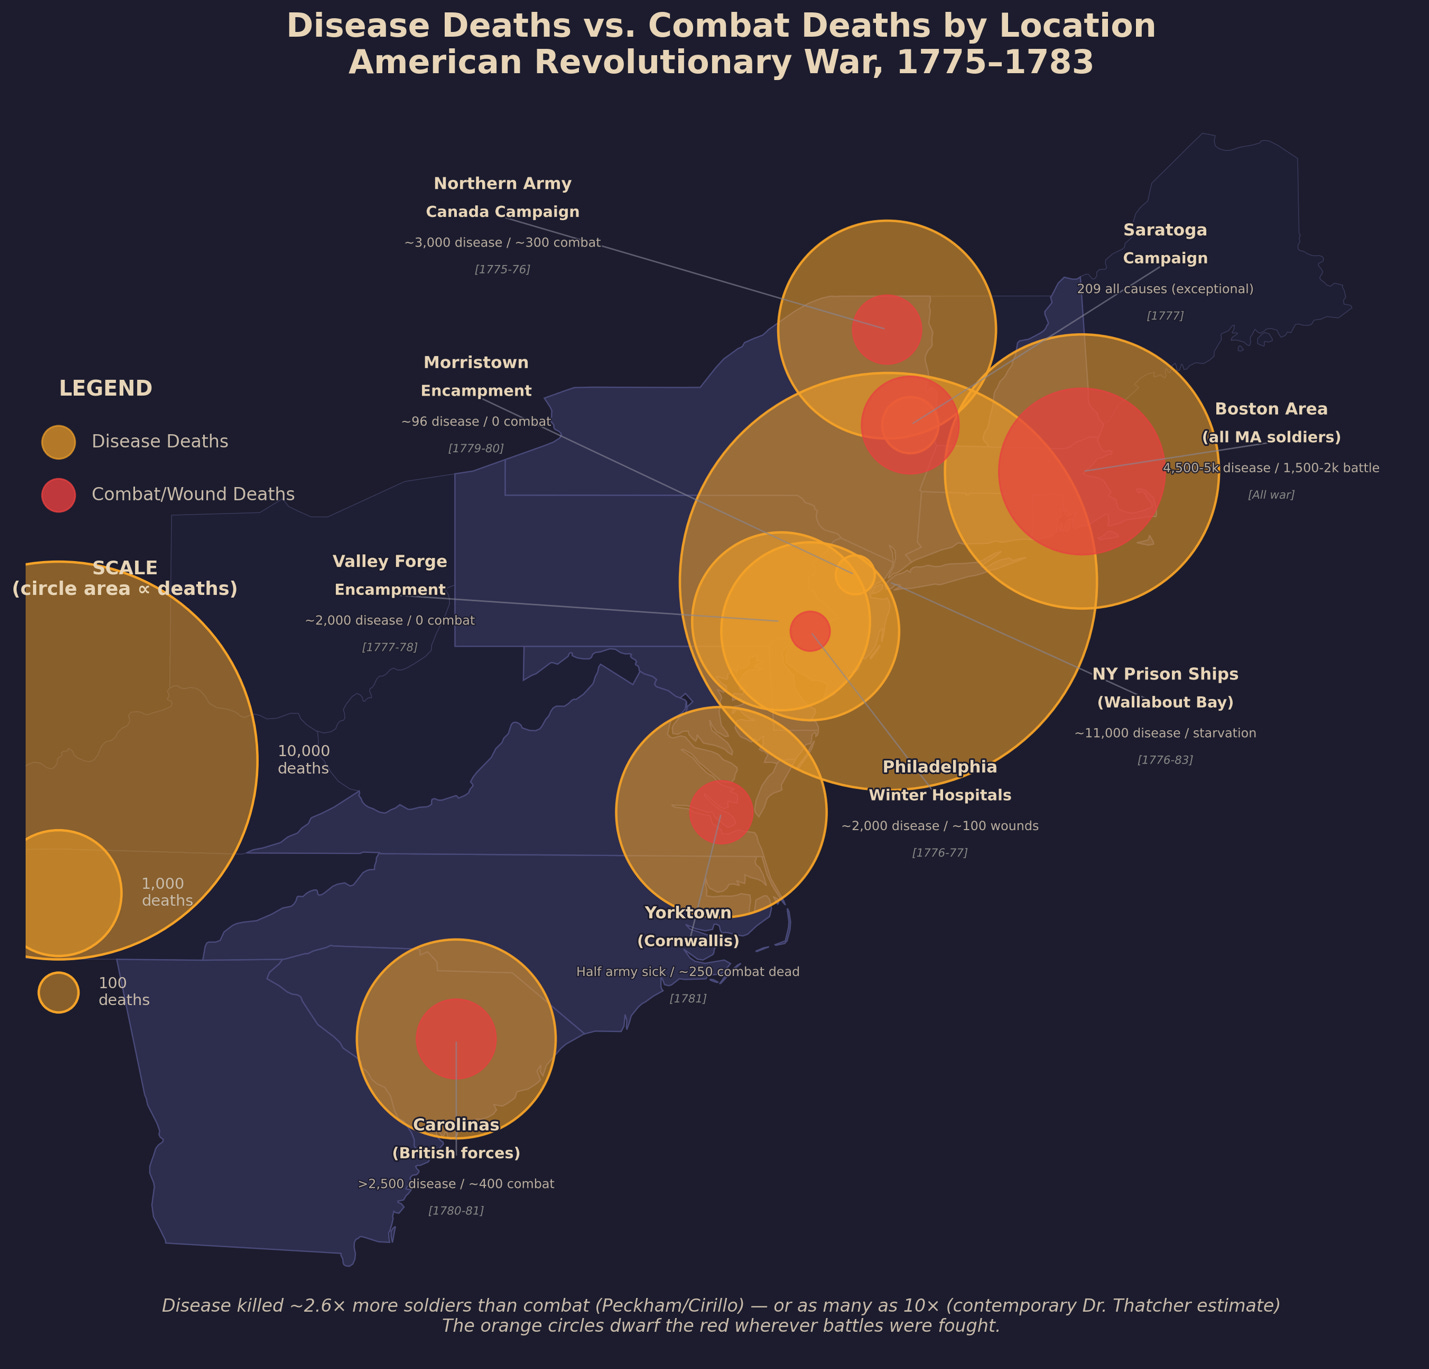
Figure 2. Proportional bubble map of disease deaths (orange) vs combat deaths (red) at key locations during the war. Circle aria is proportional to deaths. New York Harbor cluster represents ~11,000 prison ship deaths
Encampments as Epidemiological Hotspots
Valley Forge (Dec. 1777- June 1778)
Valley Forge entered the American mythos as a story of freezing soldiers and a miraculous transformation, but the epidemiological reality has changed in recent years. A 2021 re-analysis of the data in the Journal of the American Revolution drew on 27 weekly troop strength return documents. They found that roughly 19,000 Continental troops had entered the encampment on December 19th, 1777, about 8,000 higher than the 11,000 long cited in textbooks. This matters epidemiologically because it means mortality rates were lower proportionally than the commonly stated 18% (it was really ~11%), but with an overall larger death toll. Current estimates put it at around 1,900 deaths across 165 days, implying something like 2,000-2,500 deaths when the 18 unaccounted for days are included. Cold and starvation were not direct killers for the most part, but come spring the brutal mortality began. Deaths rose from about 8 per day from January to February to about 13 per day in the Spring (a 60% increase despite better weather and improved supplies).
Morristown (Dec. 1779- June 1780)
While overshadowed by Valley Forge in popular memory due to the death counts, Morristown was hit by a much harsher winter. They had 26 snowfalls and temperatures reaching record lows with four to six feet of snow accumulating. While a more severe Winter overall, they had less than 100 deaths at Morristown during the encampment.
British Quarters in Cities
British forces, primarily quartered in cities like New York, Philadelphia, Newport, and Charleston, had better access to housing, sanitation infrastructure, and supply chains, resulting in an epidemiological advantage that contributed to better disease mortality. While definitely not trivial, it was consistently lower than the Continental forces facing the same pathogens in worse conditions. AMEDD estimates British annual disease mortality at ~ 100 per 1,000 vs the ~180-200 per 1,000 in the Continental army.
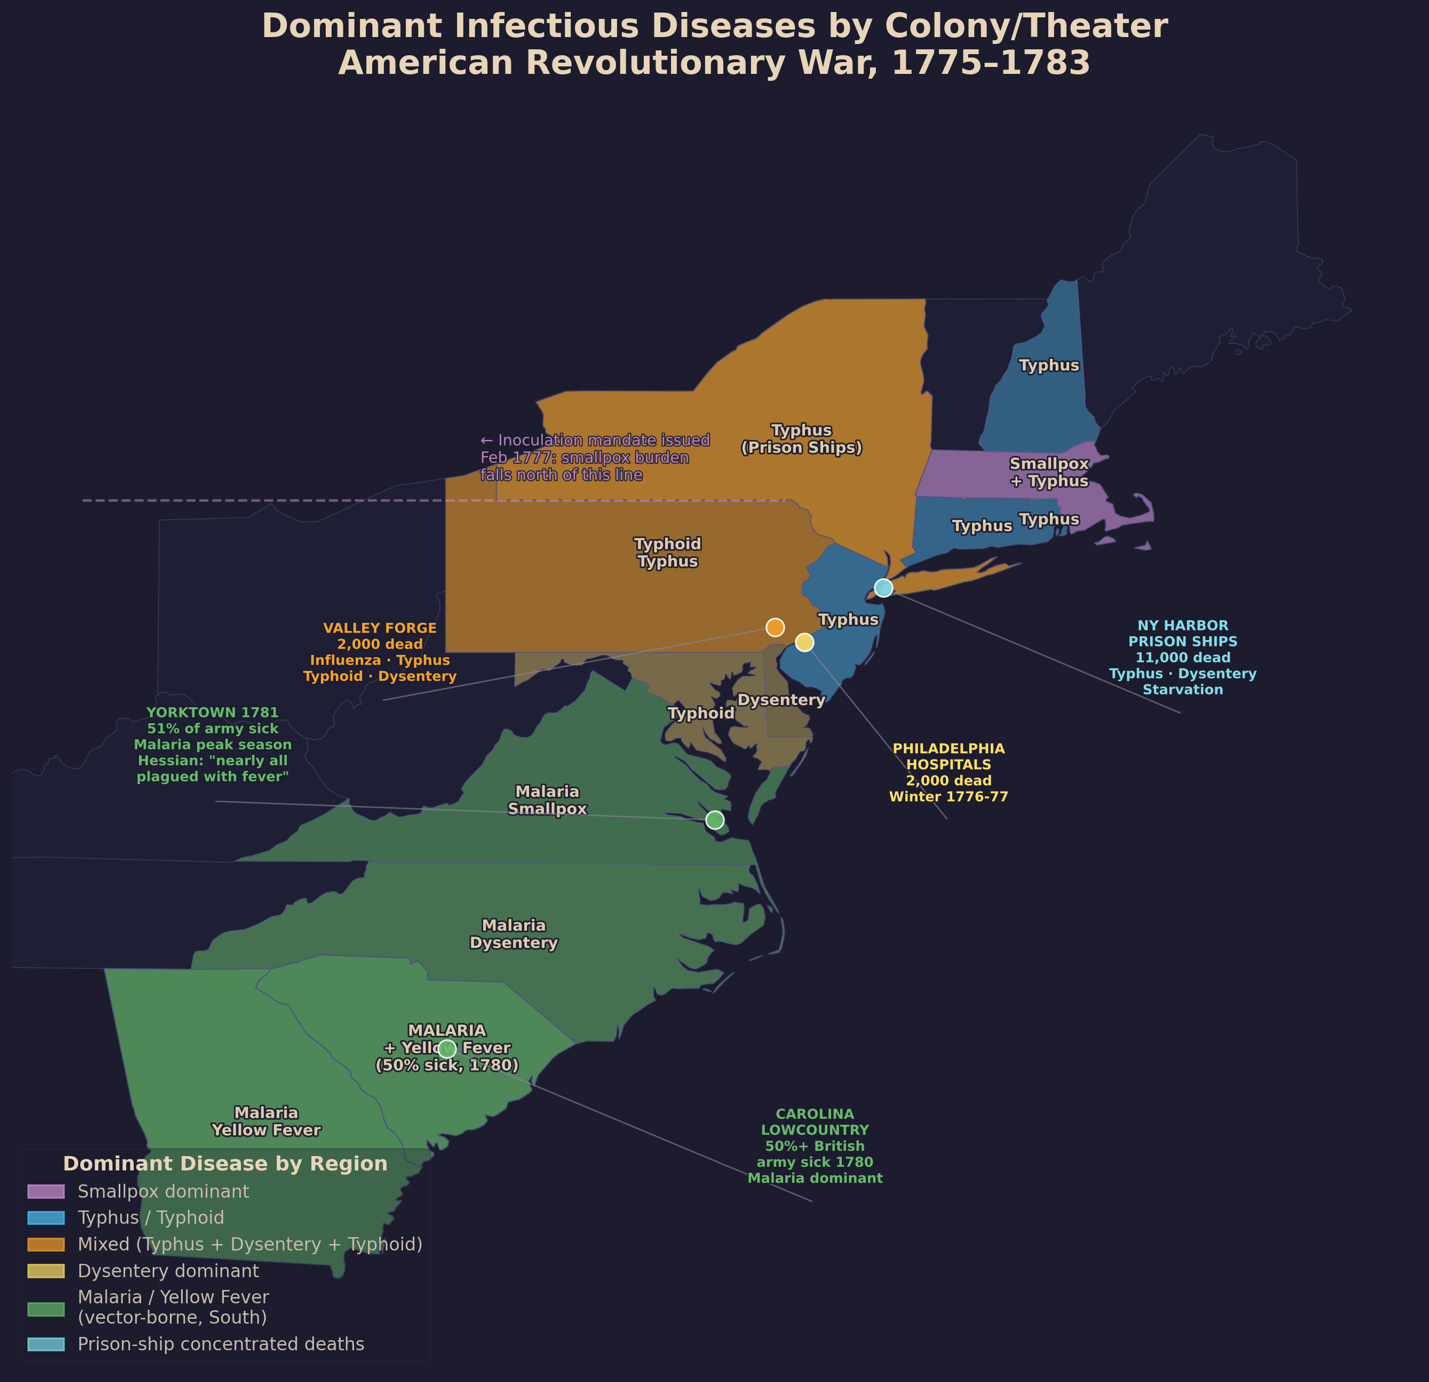
Figure 3. Dominant infectious disease by colony/theater. Color intensity reflects mortality burden. Vector-borne disease (green) dominated the South, typhus and respiratory disease (blue/orange) dominated the North, prison-ship deaths (cyan) concentrated in New York Harbor.
The Prison Ships: A Special Circle of Epidemiological Hell
No Revolutionary War site had a higher absolute mortality rate than Wallabout Bay, with at least 16 British prison ships being stationed there from 1776 to 1783. Headed by the infamous HMS Jersey, they represented a concentrated cocktail of disease, malnutrition and human suffering with little parallel in the war. The Jersey was originally a 60-gun ship built for a 400-man crew, but was routinely stuffed with 1,100-2,000 prisoners. With portholes sealed shut and iron-barred breathing holes drilled in the hull in their stead, the air became so oxygen-depleted that lamps couldn’t stay lit and bodies would go undiscovered for days. Disease was circulating in the holds, with dysentery, typhus, smallpox, yellow fever, and more draining the life of those on board. Contemporary estimates put somewhere around 11,000 having died aboard the prison ships, some noting this as a lower bound.
The causes of death aboard the prison ships reflects their conditions. Typhus indicated an infestation of lice in the holds; dysentery was indicative of contaminated water; scurvy of a lack of fresh food; pneumonia of a blistering cold while sealed in with various diseases; and smallpox ripping through the unimmunized).
Starvation, Exposure, and Neglect
While not exactly easy to cleanly separate from disease mortality in an 18th-century military, starvation and exposure were synergistic pathways to a similar end. Severe caloric deficiency would suppress the immune system, converting what could have been a subclinical infection into a lethal one. Those who died of typhoid and dysentery at Valley Forge in the Spring were doing so at such high rates due to months of inadequate nutrition from their rations.
The official ration of the Continental Army consisted of 1 pound of beef or ¾ pound of pork or 1 pound of salt fish and 1 pound of bread or flour per day, 3 pints of peas or beans per week, 1 half pint of rice per week, and 1 quart of spruce beer or cider per day, but it was consistently unavailable due to supply system collapses. Meat would run out for days at a time and several times soldiers went without any food at all for several days. This type of malnutrition, when combined with the vast rates of infectious disease, became a lethal feedback loop.
Washington’s Choice to Inoculate
In February of 1777 George Washington made a decision that may have been as consequential for American victory as any action on the battlefield; he ordered the mandatory inoculation of Continental troops against smallpox. The context was the near-catastrophe of the Canada Campaign of 1775-1776 which has been destroyed by smallpox. The Northern Army was riddled with disease and new recruits would be quarantined for 30 days as a precaution. This resulted in a tension between readiness and prevention. Washington believed that the British were deliberately sending infected individuals into the American lines; a belief still not proven true or false.
Inoculation in 1777 was a result of variolation, whereby live smallpox material from an active pustule would be introduced through a small incision. This typically resulted in a milder infection than natural infection and resulted in lifelong immunity. The difference before and after is striking, with major outbreaks destroying entire campaigns before, and never overwhelming an American army thereafter.
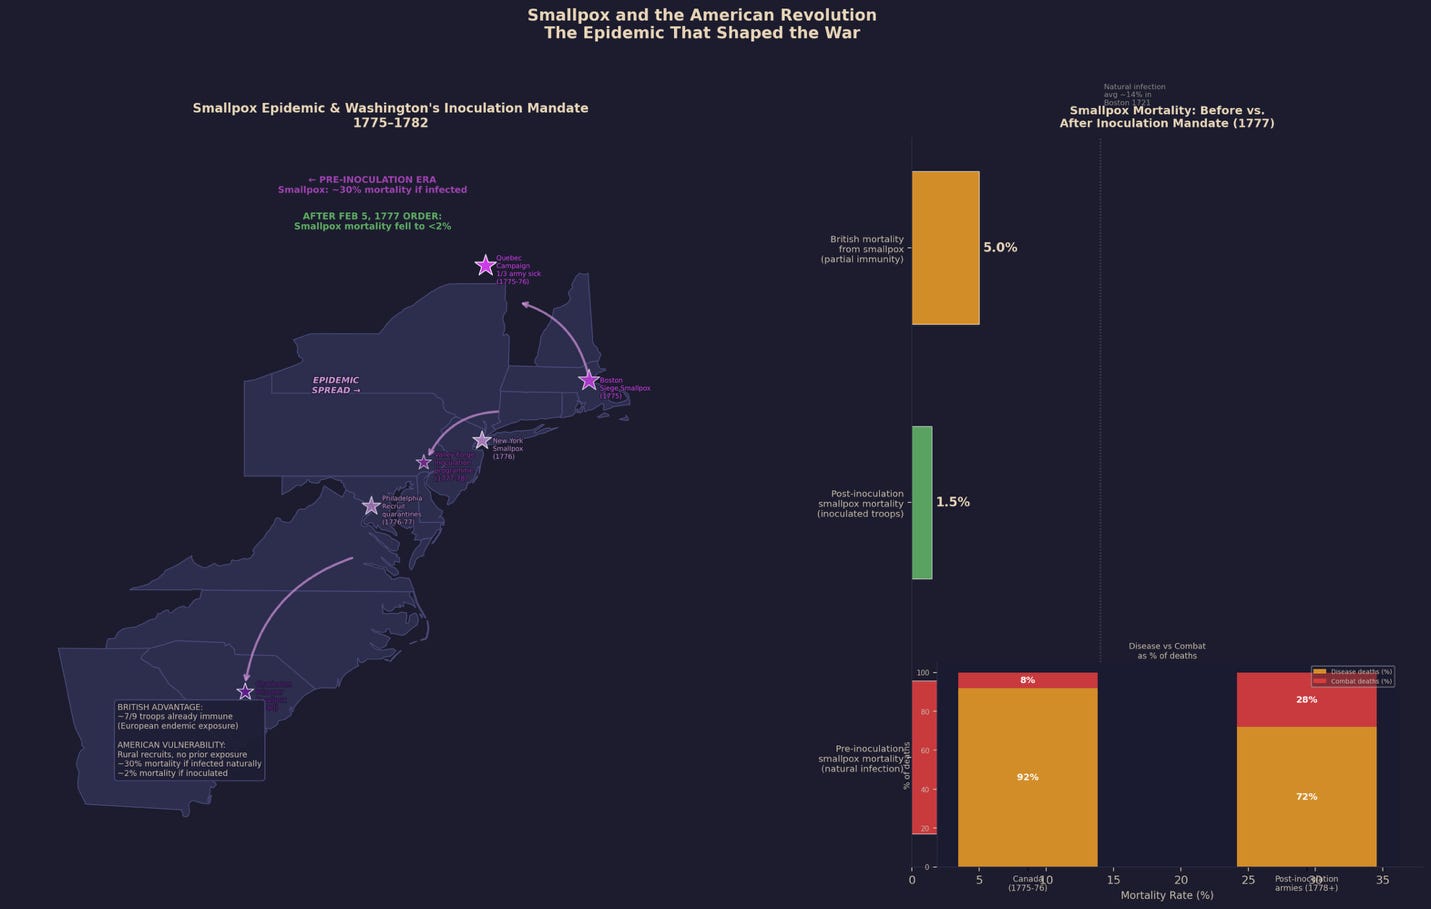
Figure 4. Smallpox epidemic trajectory and Washington’s inoculation mandate. Left: geographic spread with key outbreak locations. Right: mortality comparison before vs. after inoculation, and disease-as-percentage-of-deaths by campaign period.
Comparative Risk: Continental vs. British vs. Hessian
Annual Mortality Rates per 1,00 Soldiers (AMEDD Duncan Estimates)
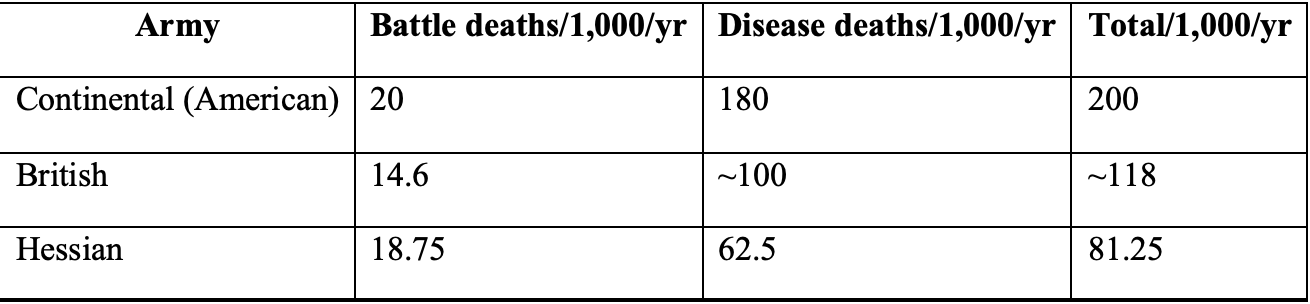
Differential mortality by army reflects three major factors: prior immune exposure, supply chain/sanitation quality, and theater of operations. The most noticeable number here is the 180 deaths per 1,000 per year from disease among the Continental army (9x their battle rate and roughly 3x that of the Hessians). That gap reflects the differences in susceptibility in rural American recruits with little prior exposure compared to those who grew up in areas with endemic infections. It’s also indicative of better supply chains among the British and Hessian troops, having been quartered in better facilities and having more reliable commissaries. It’s also where the POW deaths fall, having suffered those catastrophic mortality rates in the British prisons. These death rates also likely overrepresent those in the lower ranks, as officers would have had access to better rations as well as private living spaces, reducing their contact with the more infected lower ranks.
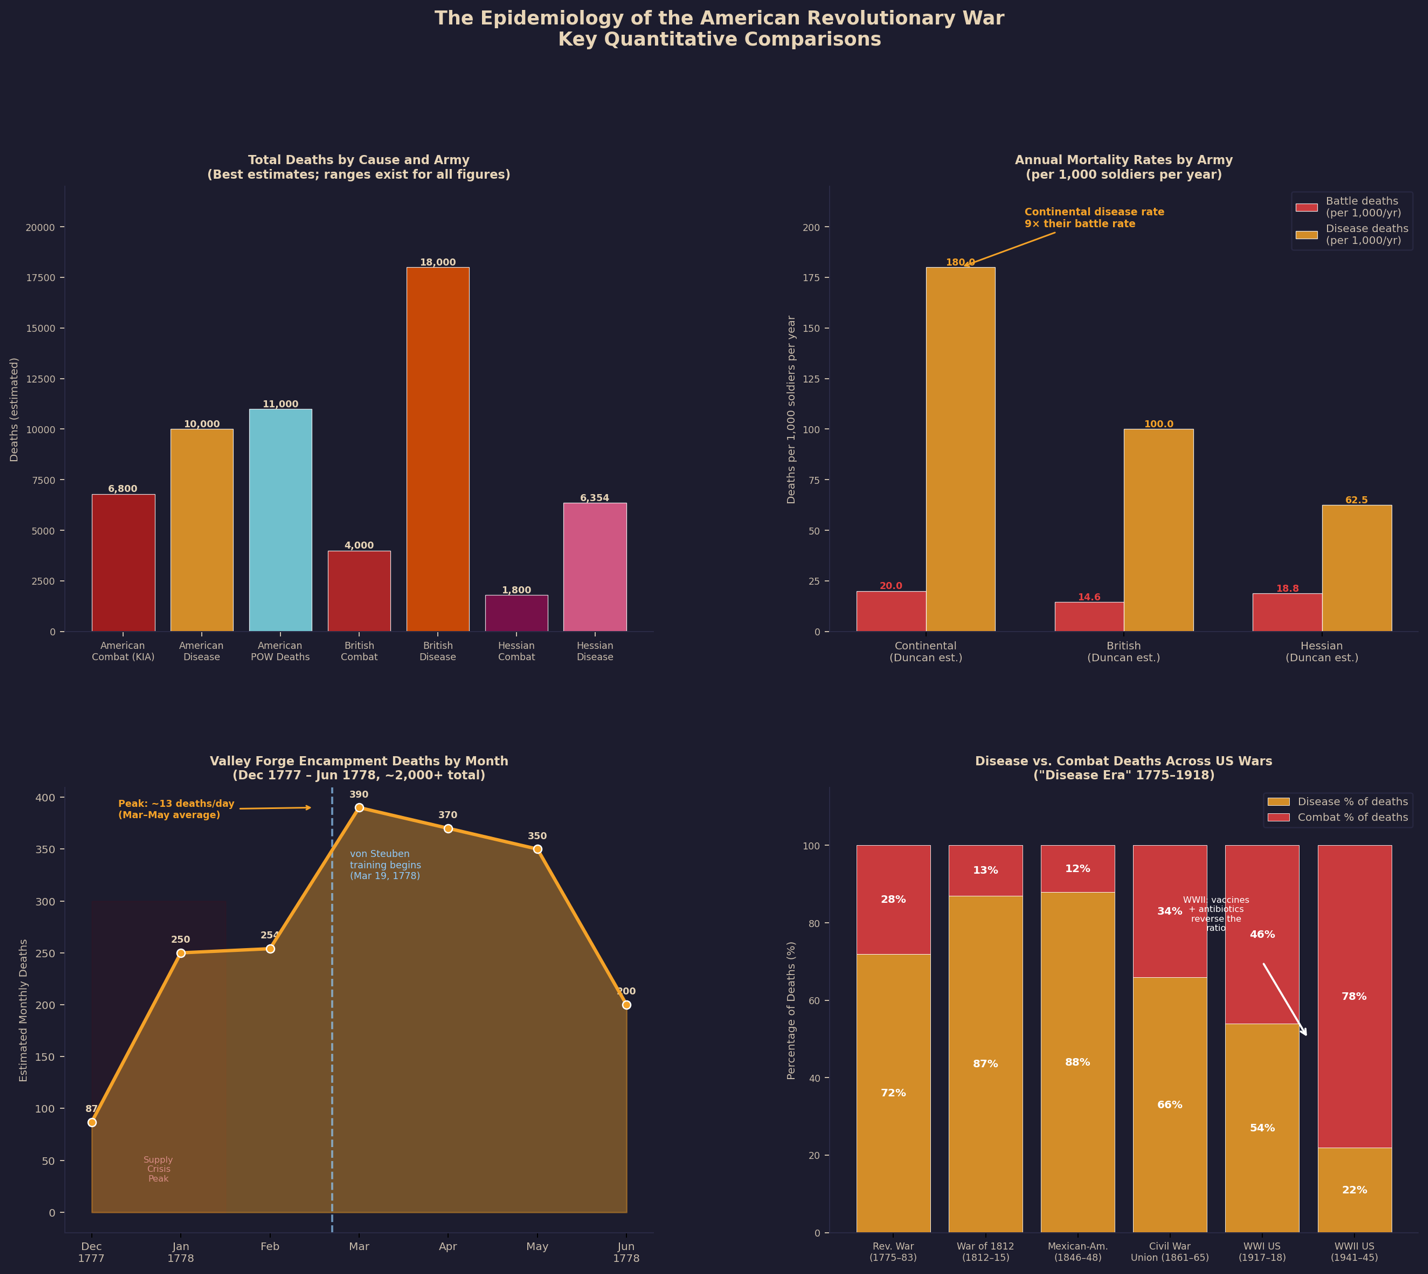
Figure 5. Four-panel quantitative summary: (A) total deaths by cause and army; (B) annual mortality rates per 1,000; (C) Valley Forge month-by-month deaths; (D) disease vs. combat deaths across American wars, illustrating the “Disease Era” 1775–1918.
What the Data Can and Can’t Tell Us
Readers with training in epidemiology or statistics will likely recognize some of the structural problems with an analysis like this due to the evidence base at hand. We have denominator uncertainty, for example, where the total number of men who served is itself disputed. Estimates for the Continental Army range from 231,000 to over 400,000 depending on whether or not short-term militia service is included. Every morality rate calculated from an unclear denominator should be expressed with uncertainty made clear. We also see misclassification in causes of death. 18th-century physicians couldn’t distinguish typhus from typhoid, malaria from yellow fever, or pneumonia from pleurisy. You end up with names like “camp fever”, “putrid fever”, “bilious fever”, and “intermittent fever” which are descriptors as opposed to diagnoses. There is also selection bias in what records survived. Better organized units were more likely to have surviving records compared to militias which would have poor records when captured at all and are systematically underrepresented. Even the pension files have this bias, as they document the men who lived long enough to apply and those whose families had the literacy and stability to even file such claims.
Stepping back from the epidemiological difficulties, individual encampments, and our casualty tables, we see a clearer picture of the American Revolution having been won through endurance in the face of an overwhelming biological adversity. This was the case of just about every war that was won prior to 1945. Before that, the primary experience in war was disease, exhaustion, hunger, and waiting. If popular memory of the Revolution focuses so heavily on heroism and decisive battles, the data is waiting to remind us that victory in 1783 was reliant on a triumph over the biological realities of the 18th century.
The Edge of Epidemiology is a reader-supported publication. To receive new posts and support my work, consider becoming a free or paid subscriber.